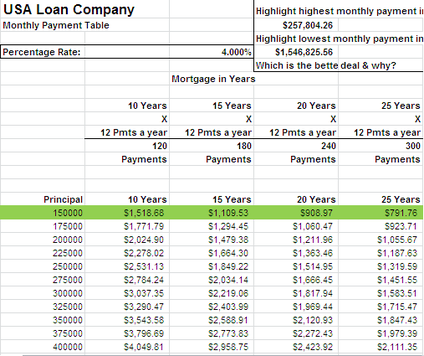
This Excel Activity was calculating mortgages for yachts. It introduced a new skill which was using the payment formula to calculate monthly mortgage payments. We also used the fill down feature again to fill in the rest of the spreadsheet. To complete this assignment, we needed to know how to use different features and formulas in Excel to calculate accurate numbers.
One thing I did well on this assignment was following the formatting direction and making the spreadsheet neat and organized. One thing I could have improved on was adding some color and extra formatting to make it more presentable.
One thing I did well on this assignment was following the formatting direction and making the spreadsheet neat and organized. One thing I could have improved on was adding some color and extra formatting to make it more presentable.
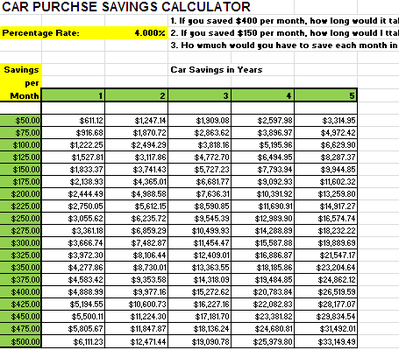
This Excel Activity calculated different car purchases and how much you would need to save. We used the future value function along with the payment formula and other formulas from previous activities. Like the last activity, we used the AutoFill feature to fill in the rest of the spreadsheet after we entered the formula into one cell instead of manually putting in each formula. In order to complete the necessary steps in this activity, we needed to know how to use the new formulas we recently learned.
I believe the best thing I did on this assignment was following the correct formatting directions to make the spreadsheet easy to read and organized. I could have added more color to make important information pop out more.
I believe the best thing I did on this assignment was following the correct formatting directions to make the spreadsheet easy to read and organized. I could have added more color to make important information pop out more.
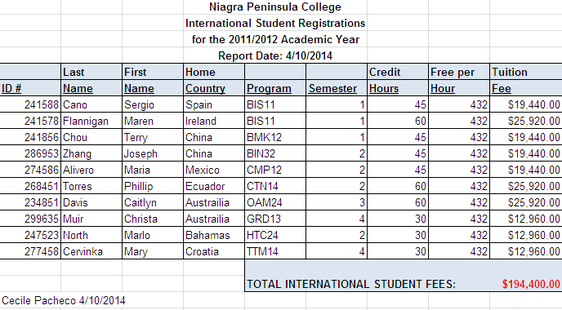
This Excel Activity was calculating tuition fees for international students. It was from the Microsoft 2010 textbook and required us to find the tuition fee using a formula and the total amount of money with the AutoSum feature. We also added extra formatting to make the spreadsheet look better.
I believe the extra formatting and colors I added to the spreadsheet made it more presentable and pleasing to look at. I could have improved on the clarity of the words and made the information easier to see.
I believe the extra formatting and colors I added to the spreadsheet made it more presentable and pleasing to look at. I could have improved on the clarity of the words and made the information easier to see.
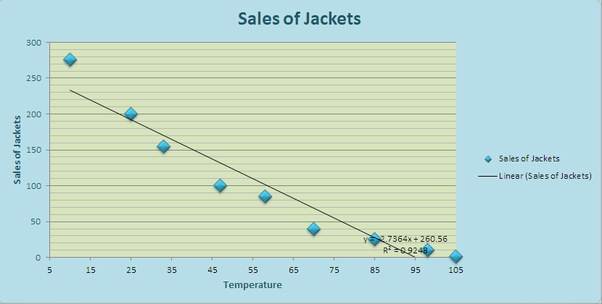
This assignment required us to create a scatter plot with the different temperatures and sales of jackets. Once we created the table of information , we used Excel to create the scatter plot with that information. We also had to use a specific chart layout to properly show the information.
For this assignment I believe I made the chart visually attractive and appealing to the eye. I could have improved on making some parts of the chart easier to read and clearer to see.
For this assignment I believe I made the chart visually attractive and appealing to the eye. I could have improved on making some parts of the chart easier to read and clearer to see.
Click to set custom HTML
For this assignment, we created short animations using a website called Scratch. We followed a step by step tutorial and pieced together building blocks to make the animation. The first tutorial was for a dance party and we also created an interactive holiday card. These assignments taught me the basics of computer programming and how to create short animations.
One thing I believe I did well was making the animations fun and interactive. Each project has multiple characters, or sprites, that contribute to the animation. One thing I could have improved on was adding sound or more interactive features to the projects.
One thing I believe I did well was making the animations fun and interactive. Each project has multiple characters, or sprites, that contribute to the animation. One thing I could have improved on was adding sound or more interactive features to the projects.
