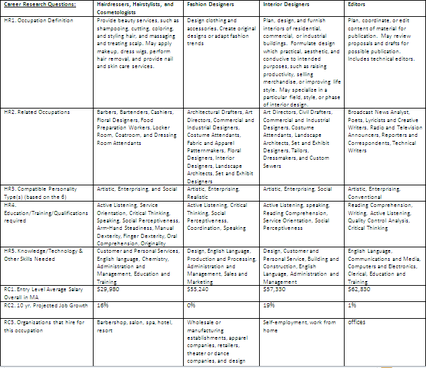
Career Research Chart
In this assignment, we took career interest surveys and chose eight different careers that we matches to our results. Once we had picked the most interesting eight careers, we used different websites such as Naviance and the Occupational Outlook Handbook to find answers to different questions that would help us better understand the careers. For this assignment we needed to know how to create create a chart on Microsoft Word and enter the information into the. This assignment taught me the different explanations of different careers that might interest me for the future.
I believe the best part of this project was the organization and set up. All of the information are easy to find and make it easy to understand what that information is explaining. One thing I could have improved on is finding more thorough and more detailed information to explain each career.
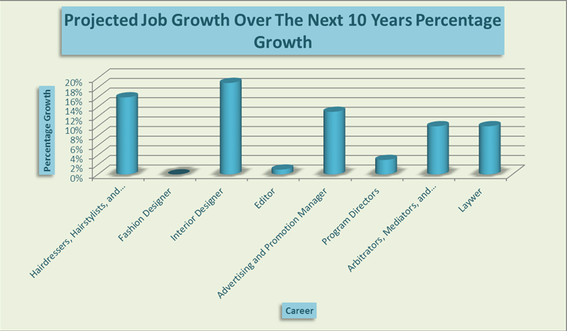
Career Data Excel Charts
For this assignment, we had to create charts using Excel based on the eight careers we researched in the chart above. First we made tables using the information from the Career Research Charts. From there we had to insert charts that displayed that information as bar graphs. By doing this assignment, I learned different excel skills that could help me in other classes and assignments in the future.
One thing I believe I did well was making the charts and tables look good while also incorporating all the information that was needed. One thing I could have improved on this assignment was trying out different templates to try to make the information more understandable.
