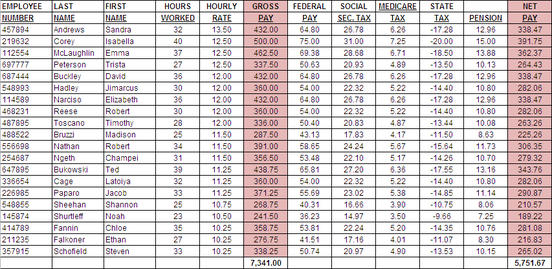
For this assignment, we followed a series of direction and formatted the Excel sheet according to what the directions said. To complete this assignment we needed to know how to use different tools in Excel. By doing this assignment I became better at using Excel and the different features within in.
One thing I believe I did well on with this assignment was following directions and organizing the information given. My Excel spreadsheet looks very similar to the example of how the end result should look like. One thing I could Have improved on was using more shortcuts to make the work easier for myself.
One thing I believe I did well on with this assignment was following directions and organizing the information given. My Excel spreadsheet looks very similar to the example of how the end result should look like. One thing I could Have improved on was using more shortcuts to make the work easier for myself.

In this assignment we were required to create a PowerPoint Presentation using Microsoft PowerPoint. We used our career research and different information we gathered to make this presentation that we will share with the rest of the class. In this PowerPoint we explained the steps we took throughout the career exploration process and what information we found.
I believe the best thing I did with this presentation was the organization and overall look of the PowerPoint. One thing I believe I could have improved on was putting more detailed information and explaining the process better.
I believe the best thing I did with this presentation was the organization and overall look of the PowerPoint. One thing I believe I could have improved on was putting more detailed information and explaining the process better.
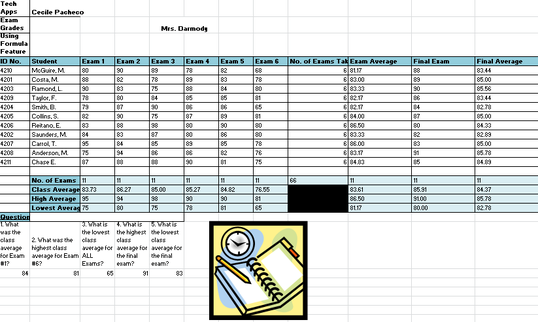
For this Excel activity, we had to follow directions on how to format an Excel spreadsheet. We needed to be able to use Excel and the different formula features in Excel to create a fake grade book. This assignment reinforced my Excel skills and taught me different features within Excel.
I believe one thing I did well was using the correct formulas and having the correct information that was needed to complete the assignment. I believe I could have improved on the overall look of the spreadsheet and formatted some of it differently.
I believe one thing I did well was using the correct formulas and having the correct information that was needed to complete the assignment. I believe I could have improved on the overall look of the spreadsheet and formatted some of it differently.
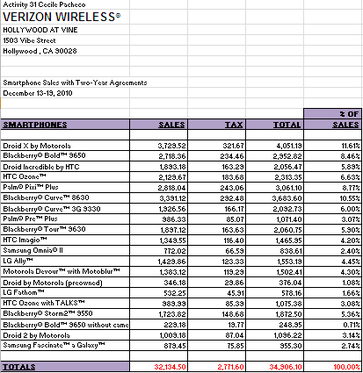
This Excel Activity required us to show the smartphone sales at Verizon Wireless. To create this spreadsheet we needed to know how to use several features and formulas within Excel. This assignment introduced me to a new skill that can be used with Excel, absolute cell reference.
For this assignment I believe I made this information organized and easy to locate like the example. One thing I could have improved on was extra formatting to make it look more presentable.
For this assignment I believe I made this information organized and easy to locate like the example. One thing I could have improved on was extra formatting to make it look more presentable.
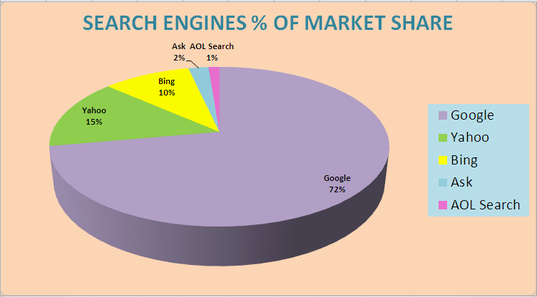
This Excel Activity introduced charts. We were required to create a chart from a data table about search engines percent of market share using Excel. For the assignment we needed to know how to create the chart on Excel and how to format it in different ways. By using this new feature I learned how to create different types of charts and graphs and format them to my liking.
One thing I believe I did well was making the graph look presentable and easy to read. There is contrast between the colors and they stand out against each other. One thing I could have improved on was also making the labels stand out and be easier to see.
One thing I believe I did well was making the graph look presentable and easy to read. There is contrast between the colors and they stand out against each other. One thing I could have improved on was also making the labels stand out and be easier to see.
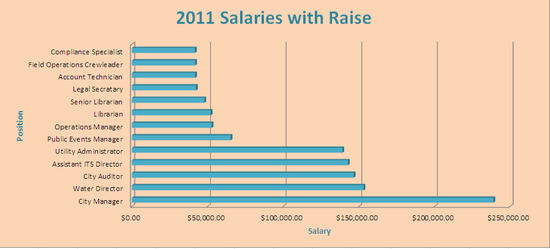
This assignment required Excel to create a table with data and then make a chart from the table like the previous Excel Activity. This activity was calculating the raises of different job positions. The data table included the employee, position, years of service, and used various formulas to calculate the raises and salaries of each employee. It introduced new formulas and taught me how to calculate different things that I may need to know in the future.
In my opinion, the chart was what I did best on. It is colorful and draws attention to the information. One thing I could have improved on was making the data table more colorful and appealing.
In my opinion, the chart was what I did best on. It is colorful and draws attention to the information. One thing I could have improved on was making the data table more colorful and appealing.
